- Click the Analytics tab on the left side of the screen.
- Click on the first drop-down box in the upper left corner and select Health (by date), (by DOF) or (Compared).
Note:
- Health (by date): Displays data in relation to calendar dates on the x-axis.
- Health (by DOF): Displays data in relation to days on feed on the x-axis.
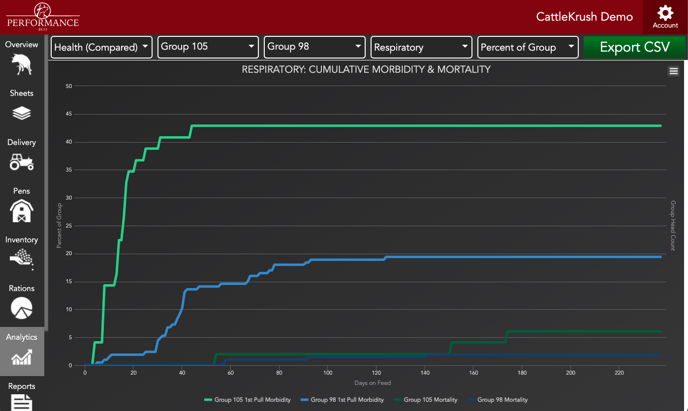
- Health (Compared): Allows you to compare two groups simultaneously by days on feed.
3. If you selected Health by date or by DOF, click on the second drop-down box in the upper left corner and select which group you wish to view.
-
- In the third drop-down box, select a diagnosis.
- In the fourth drop-down box, select a breakdown by group cumulative percentage, cumulative total head or a daily count.
- In the fifth drop-down box, select an additional graph overlay, feed intake or head count.
4. If you selected Health Compared, use the next two drop-down boxes to select two groups to compare.
-
- In the fourth drop-down box, select a diagnosis.
- In the fifth drop-down box, select an additional graph overlay, feed intake or head count.
Note: The mortality curve will only show animals previously diagnosed with a disease. Dead animals with no diagnosis prior to death will not appear on the graph.
Click here, or continue scrolling down, to view sample graphs and the type of insights gained from Animal Health Analytics.
Animal Health Related Analytics gives you the context of time in a feeding period necessary to make and monitor key management decisions. You can see the relationship between diagnoses and head count or feed intake changes, thus potentially finding points where intervention is needed. You may use the Health (by date) view to decipher if weather events, labor issues, etc. played a role in health related issues. By diagnosing animals when recording treatment costs you gain the benefits of creating a health record while improving your financial accounting.
Our Customer Success team is here to help. If you have questions, contact us by calling 515-337-2187 or email us at support@cattlekrush.com. Be sure to take advantage of our complete resource library and how-to videos created to help you succeed.
Working Cattle with the Processing App - Read this article to learn how to use the Processing App while working cattle.
Running & Exporting a Processing Report - Learn how to run and export a processing report for a single or multiple processing events.
Manage Individual Animal Health Records - Learn how to edit or backdate an individual treatment.
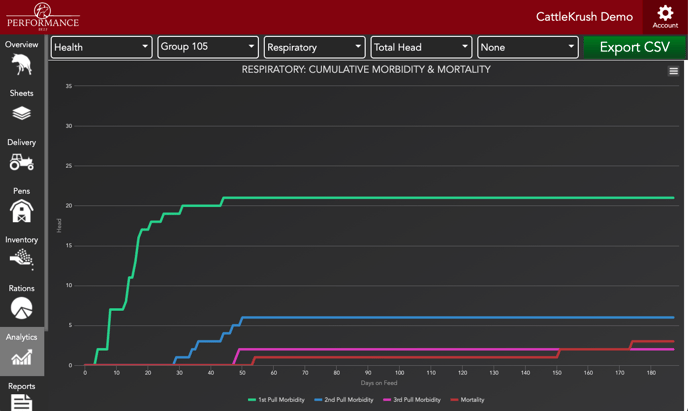
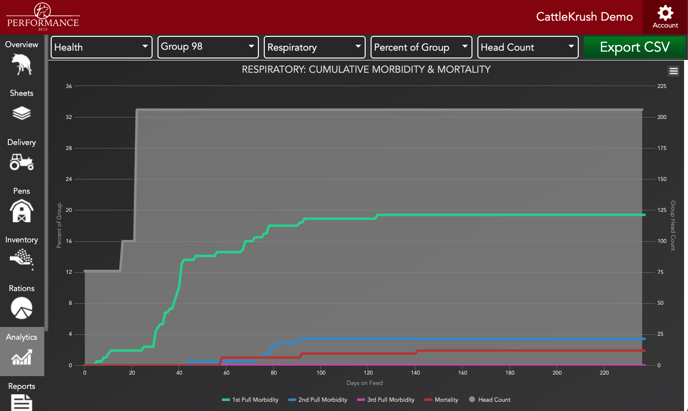
Insights to days on feed when cattle break with respiratory disease.
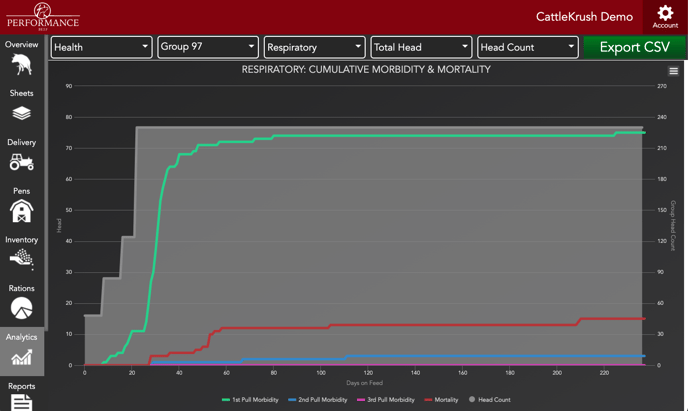
Insights to days on feed when cattle break with respiratory disease relative to when new cattle are added.
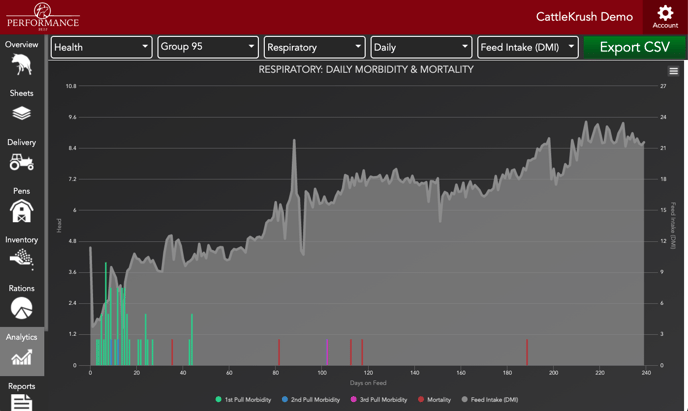
Insights to days on feed when cattle break with respiratory disease relative to feed intake patterns or mixing and feeding errors.
Insights to days on feed when cattle break with respiratory disease relative to when new cattle are added standardized by percentage of group rather than head count above.
Insights as to how the source and management may impact when cattle break with respiratory disease as well as the ability to compare the treatment/vaccine protocols of cattle with similar backgrounds.